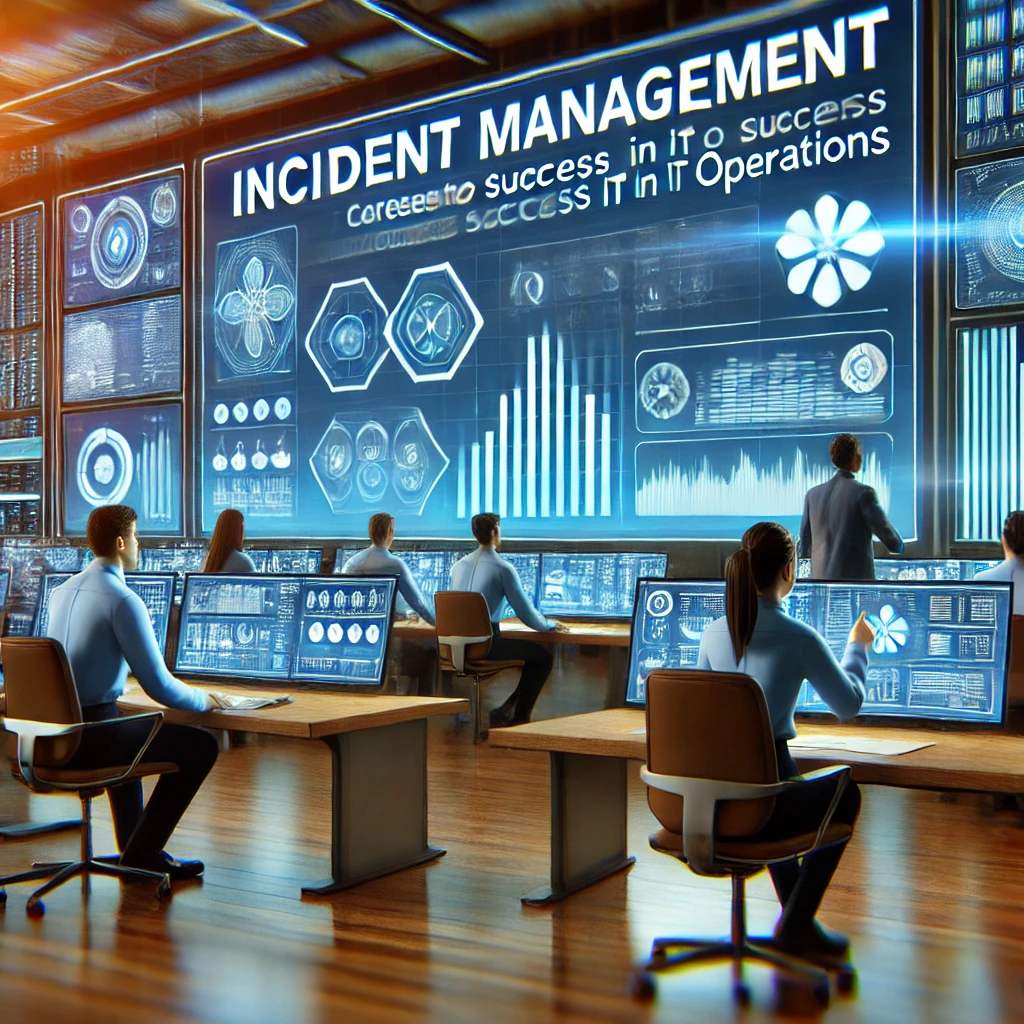
🖥️ Mastering Monitoring Tools: New Relic, Grafana, and More
🔍 Introduction
Mastering Monitoring Tools: In the world of incident management, monitoring tools play a crucial role in detecting and resolving system issues before they escalate. Tools like New Relic, Grafana, Datadog, and Prometheus provide real-time insights into system health, application performance, and infrastructure stability.
In this blog, we will explore:
- ✅ What monitoring tools are and why they matter
- 🛠️ Key features of New Relic, Grafana, and other top monitoring tools
- 📊 Best practices for using monitoring tools effectively
📌 What Are Monitoring Tools and Why Do They Matter?
Monitoring tools help IT teams track system performance, detect anomalies, and prevent outages. They provide real-time alerts, dashboards, and logs to ensure smooth operations.
🎯 Benefits of Monitoring Tools:
- 🚀 Faster Incident Resolution: Detect issues early and act proactively
- 📊 Performance Optimization: Identify slow-performing applications or infrastructure bottlenecks
- 🔍 Real-Time Insights: Gain live visibility into system health and application behavior
- 💡 Data-Driven Decisions: Use analytics and reports to improve system efficiency
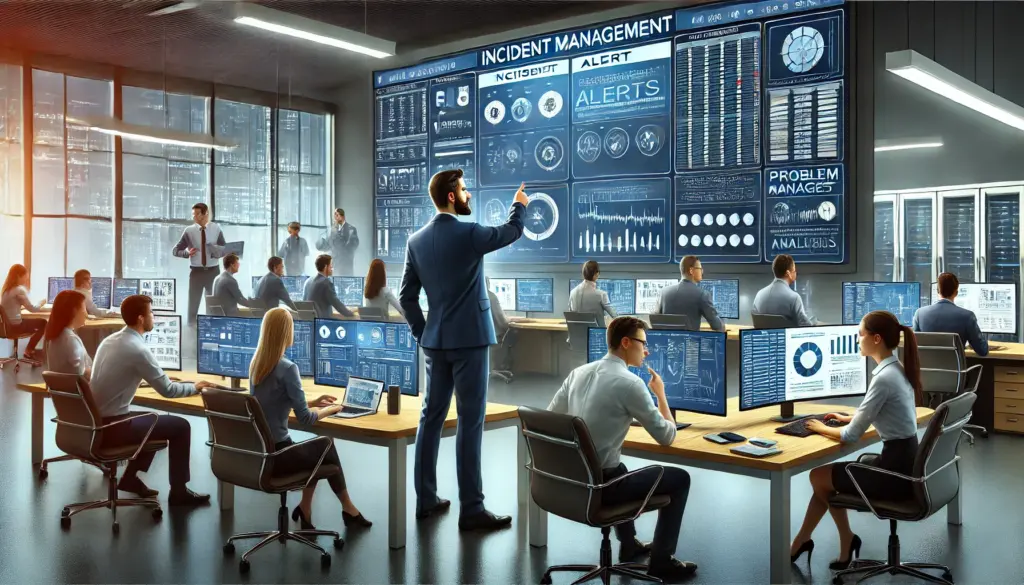
🛠️ Popular Monitoring Tools for Incident Management
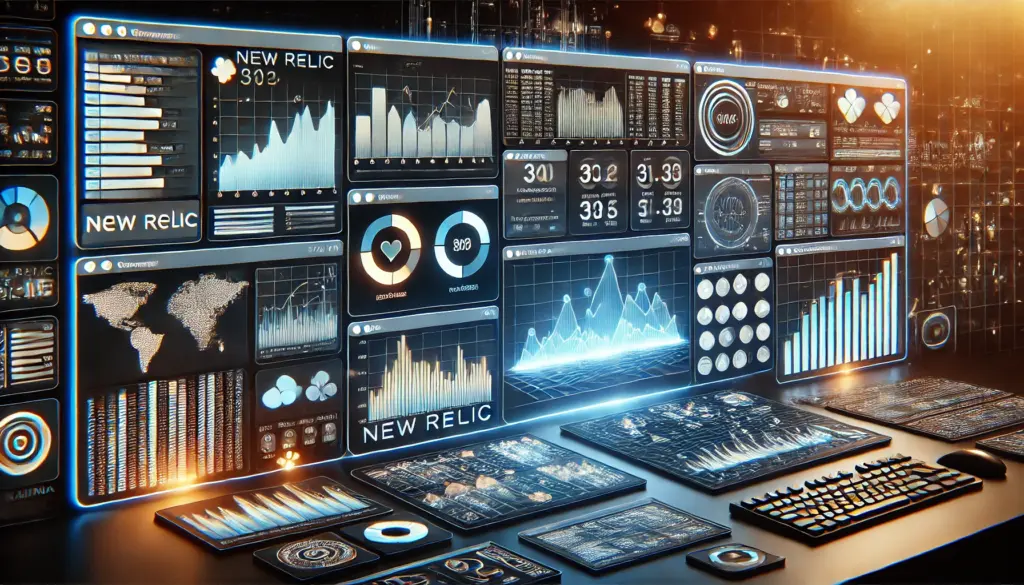
1️⃣ New Relic: Application Performance Monitoring (APM) Leader
New Relic is widely used for monitoring web applications, servers, and infrastructure.
⭐ Key Features:
- 📊 Real-time application monitoring to track errors and response times
- 🔍 Transaction tracing to identify bottlenecks in application performance
- 🚨 Alerts and notifications to detect critical issues
- 📡 Infrastructure monitoring for cloud and on-premises systems
🖼️ [Image Placeholder: New Relic dashboard screenshot]
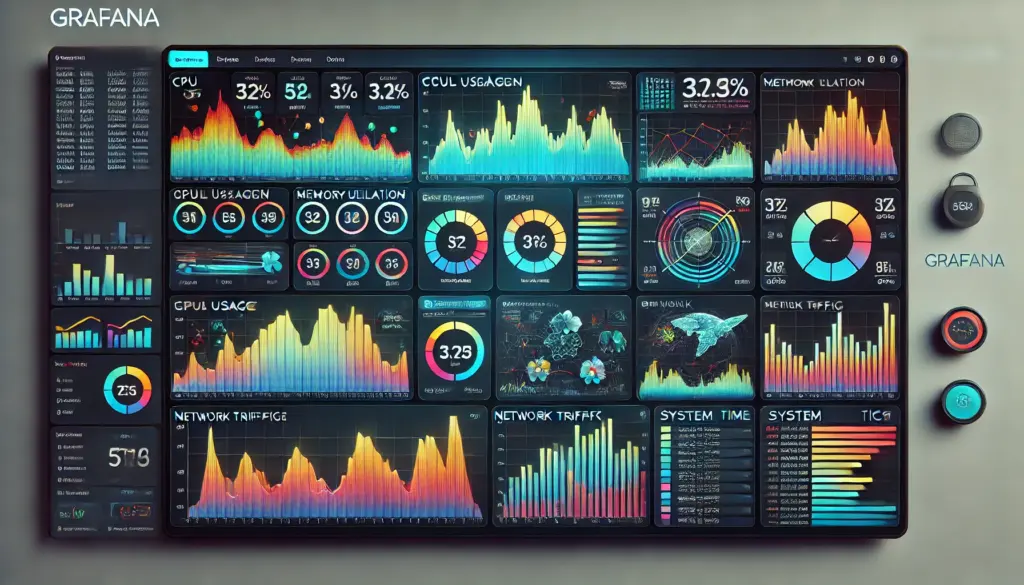
2️⃣ Grafana: Visualization & Dashboarding Tool
Grafana is an open-source tool used for creating interactive dashboards that visualize metrics from multiple data sources.
⭐ Key Features:
- 📊 Customizable dashboards to display system performance metrics
- 🔄 Supports multiple data sources, including Prometheus, Elasticsearch, and InfluxDB
- 🛠️ Real-time monitoring and alerting to detect anomalies
- 🎨 User-friendly UI for better visualization
🖼️ [Image Placeholder: Grafana dashboard showing system metrics]
3️⃣ Prometheus: Advanced Metrics & Alerting
Prometheus is a powerful monitoring system known for scalability and time-series data storage.
⭐ Key Features:
- 📡 Pull-based metric collection for real-time monitoring
- ⏳ Time-series database for storing historical data
- 🔔 Built-in alerting system for proactive incident response
- 🛠️ Seamless integration with Kubernetes and Docker
🖼️ [Image Placeholder: Prometheus monitoring graph]
4️⃣ Datadog: Full-Stack Observability
Datadog provides end-to-end monitoring for applications, logs, cloud infrastructure, and security.
⭐ Key Features:
- 🔄 Infrastructure monitoring for cloud and on-premise environments
- 📡 Log management with advanced analytics
- 🚨 AI-driven alerts for automated issue detection
- 📊 Integration with over 500 tools, including AWS, Azure, and Kubernetes
🖼️ [Image Placeholder: Datadog dashboard with cloud monitoring]
🏆 Best Practices for Effective Monitoring
To maximize the benefits of monitoring tools, follow these best practices:
✅ 1. Define Key Metrics
- Identify critical system health indicators like CPU usage, memory, and response time
- Focus on application-specific metrics such as database performance and error rates
🚨 2. Set Up Alerts & Notifications
- Configure threshold-based alerts to detect anomalies early
- Use multi-channel notifications (email, Slack, PagerDuty) for faster response
📊 3. Use Dashboards for Better Visualization
- Customize dashboards to track KPIs and system health
- Share real-time dashboards with teams for improved collaboration
🔄 4. Automate Incident Response
- Integrate monitoring tools with incident management platforms (ServiceNow, Freshdesk)
- Use auto-remediation scripts for faster issue resolution
📈 5. Regularly Review and Optimize Monitoring Strategies
- Conduct monthly performance audits to improve system monitoring
- Train teams on new monitoring features and best practices
🖼️ [Image Placeholder: Flowchart showing best practices for monitoring]
🚀 Conclusion
Mastering monitoring tools like New Relic, Grafana, and Prometheus is essential for incident management and system reliability. By leveraging their features and following best practices, IT teams can proactively detect, analyze, and resolve incidents before they escalate.
By implementing an effective monitoring strategy, organizations can improve system performance, security, and user experience.
🚀Learn More:
💡 Which monitoring tools do you use? Let us know in the comments!